

Prepare the required forms and provide data for decision-making in a minute!
Suitable for various scenarios and industries to support company
Sales Funnel
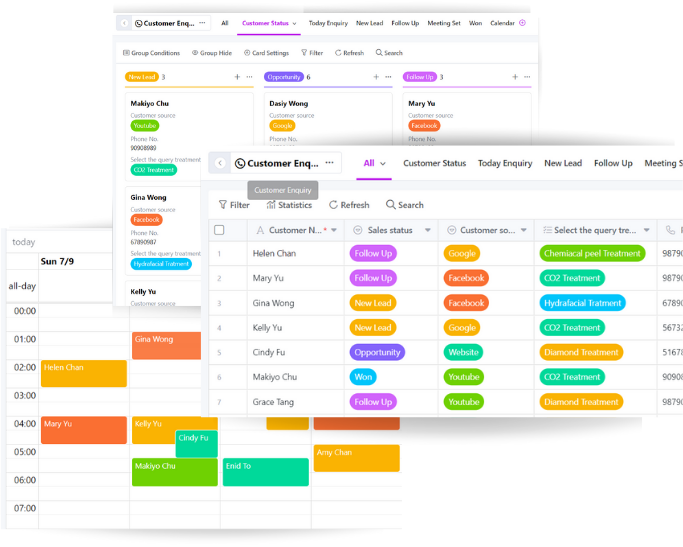
Customer Analysis
Inventory Management
Purchase Order
Revenue Trends
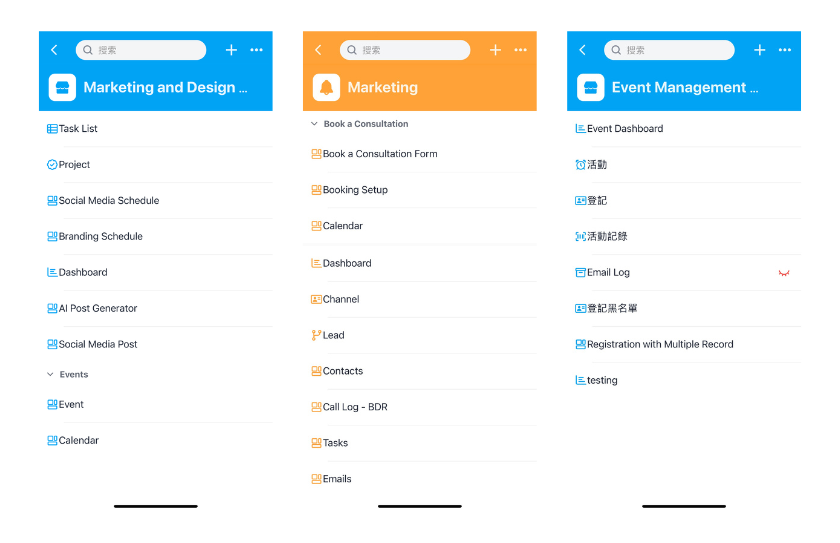
Event Management
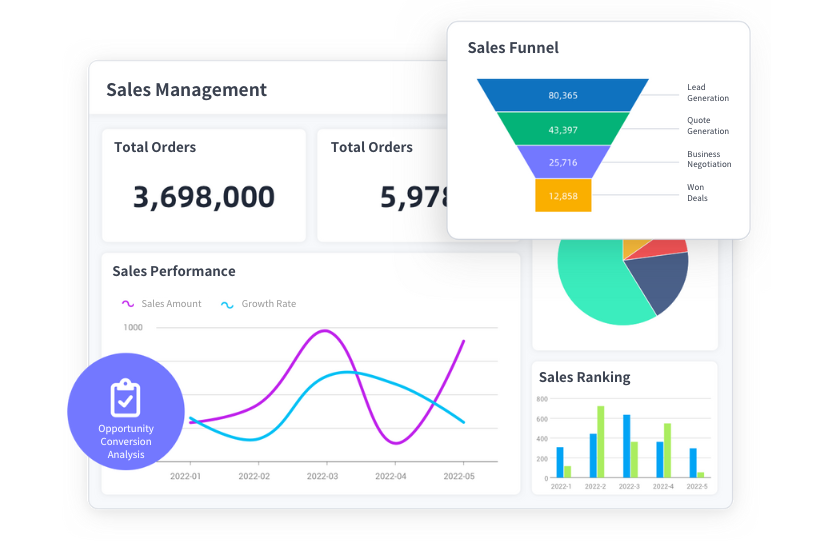
Variety of graphical tables are available
YOOV PLUS provides a variety of tables and charts to support statistics, comparisons, trends and other analysis needs, and can flexibly display data analysis results.
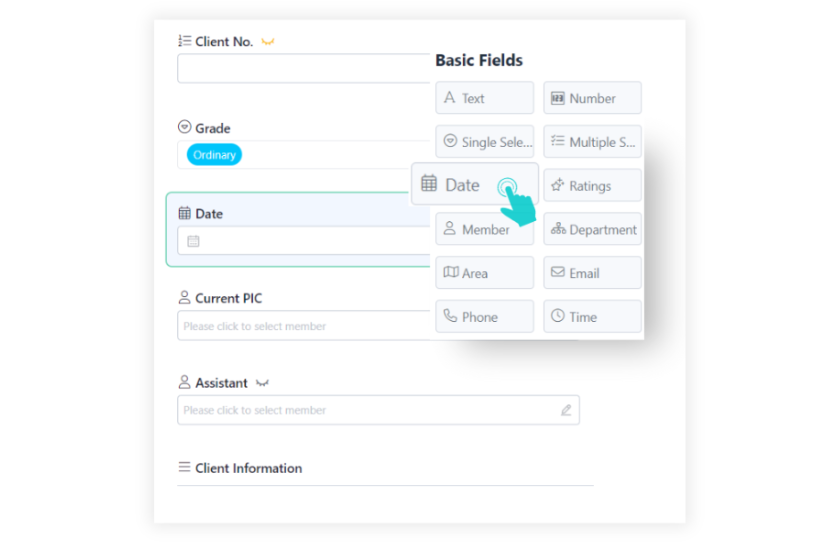
Easily find data sources
Automatically integrate data sources and find relevant data just 1 click
Multidimensional analysis
Customized data dimensions and comprehensive analysis of multiple factors allow users to gain multi-dimensional insight into business development trends from reports.
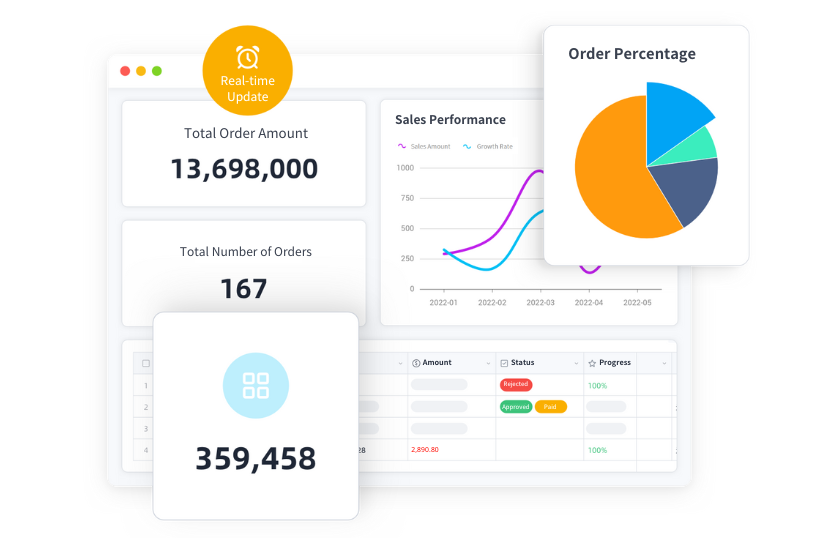
Provide a real-time report
Tables are synchronized with the database to reflect real-time data. Dig deeper into real-time data to make a smart decision.
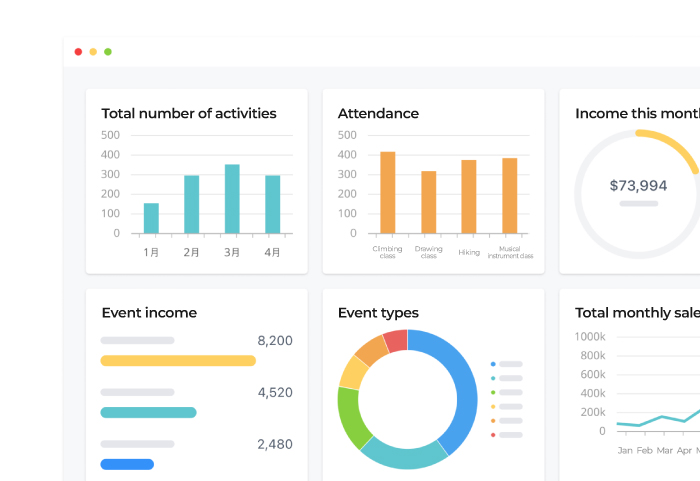
Customized data dashboard
Customize personalized reports according to your thoughts or habits, you may easily understand the company's current situation at a glance and formulate the company's future strategies.
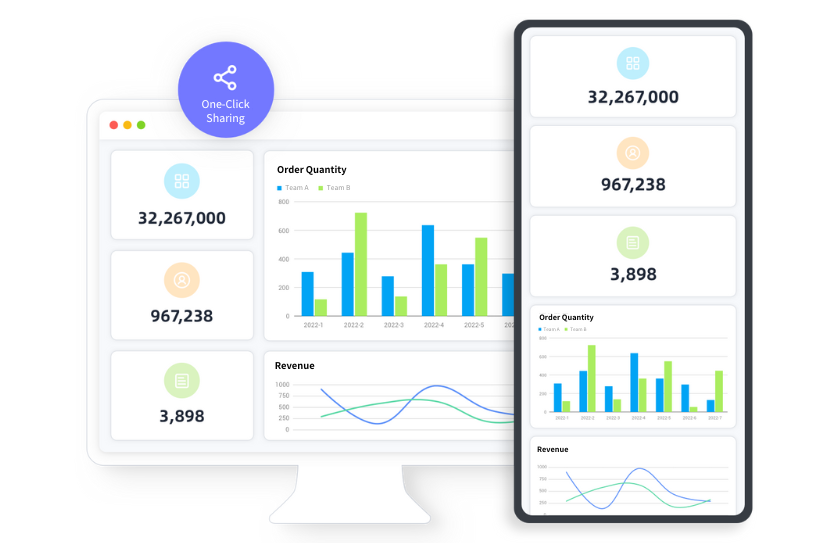
Mobile-Friendly
Check data and report on the go with YOOV PLUS's mobile-friendly interface. Keep track of company status anytime, anywhere.